Linear interpolation
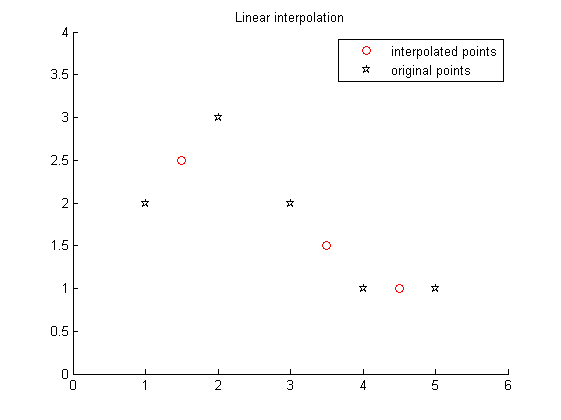
x=[1 2 3 4 5];
y=[2 3 2 1 1];
xnew=[1.5 3.5 4.5];
ynew=interp1(x,y,xnew);
h=figure;
set(h,'Color','w')
hold all
title('Linear interpolation')
plot(xnew,ynew,'or')
plot(x,y,'pk');
axis([0 6 0 4]);
legend('interpolated points','original points')