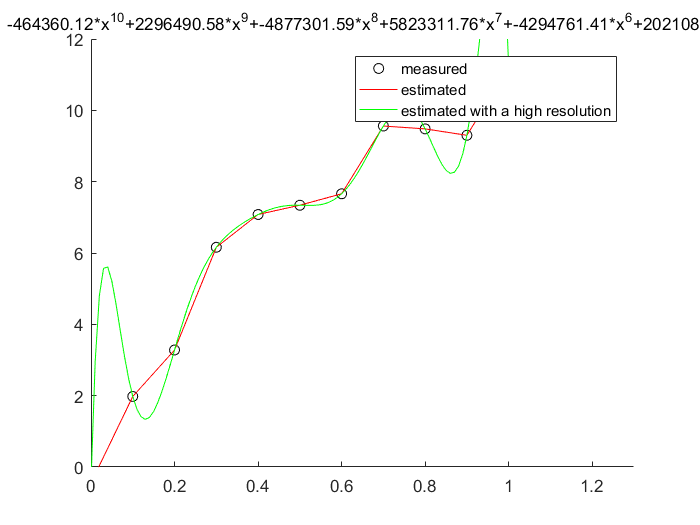
x=0:0.1:1;
ym=[- 0.447 1.978 3.28 6.16 7.08 7.34 7.66 9.56 9.48 9.30 11.2];


a=cell(10,1);
MSE=zeros(10,1);
for i=1:10
    a{i}=polyfit(x,ym,i);
    y=polyval(a{i},x);
    MSE(i)=sum((y-ym).^2);
end

[val,pos]=min(MSE);
degree_optimal=pos;
param_optimal=a{pos};

y=polyval(param_optimal,x);
x1=0:0.01:1;
y1=polyval(param_optimal,x1);
h=figure;
set(h,'Color','w')
hold all
title('')
plot(x,ym,'ok')
plot(x,y,'-r')
plot(x1,y1,'-g')
legend('measured','estimated','estimated with a high resolution')

s='';
for j=1:degree_optimal+1
    s=[s sprintf('{%10.2f}*x^{%d}',param_optimal(j),...
        degree_optimal-j+1)];
    if j<degree_optimal+1
        s=[s '+'];
    end
end
text(-0.2,12.5,s);
axis([0 1.3 0 12])